
 by
by In this article, today we will be discussing about the Morning Star Candlestick Pattern. We’ll be discussing the Morning Star pattern which is just the opposite of the evening star pattern.
Morning Star Candlestick Pattern is a three candlestick pattern and it signifies that there has been a dramatic fall in the prices and now the Sun is about to rise, so prices start making new highs.
The Morning Star Candlestick Pattern is a pattern seen in a candlestick chart, a popular type of a chart used by technical analysts to anticipate or predict price action of a security, derivative, or currency over a short period of time. So let’s get started.
How to find Morning Star Candlestick Pattern?
The Morning Star is a three candlestick pattern that I’ve already discussed. To find Morning Star Candlestick Pattern basically we have 3 steps are as follows:
1. Bearish Candle
- The first condition is that there has to be a prior downtrend i.e. prices have been making new lows.
- It is a three candlestick pattern that we have discussed and the first candlestick will be a very big red candlestick.
- This shows us that the sellers are still in control and the bears are pushing the prices lower.
- So there has to be a very good amount of volume on this day to confirm that that downtrend is still in force.
2. DOJI
- The second candlestick is a doji or a star and this shows us that there is indecision in the market.
- We can see from this candle, the prices open at this level,
- it went all the way down which is indicated by the shadow,
- and at the end of the day, it closed over here just a very minutely up a level.
- So this shows us that there is very heavy indecision on the day of the doji.
- The buyers and the sellers are now agreeing at an equilibrium price.
- The sellers are now willing to let go of the selling pressure at this price level.
- So this will act as a very important support for the stock.
3. Bullish Candle
- The next day following the doji or the star will gap up and it will be a bullish day.
- Ideally, the candle has to close in to the first day or the red candle.
- It has to close into this day but it is not always necessary.
- Our condition should be that it should be a very good bullish day which is followed by a very large volume,
- which shows us that now the sellers have lost control of the market,
- and the Bulls have stepped in and prices will rebound from the support level to make a new high.
Formation of the Morning Star Candlestick Pattern
- So let us see the conditions. The first criteria are that there has to be a major downtrend or a minor downtrend.
- The body of the first candle needs to be black or red in color which shows us in the downtrend is in force and the second candle is a doji which shows indecision in the market.
- The third day should be the opposite in color of the first day. So as we discussed, the first day was red in color, thus the third day needs to be green in color which is showing us that the Bulls are now back in control.
- As we discussed, in a prior downtrend,
- The first candle should be red in color. Good volume on this day.
- The second needs to be a doji, the color is not important,
- and the third should be green in color which is opposite to the first candle and it should close it should be a large candle and should ideally close into the first candle.
Signal Enhancement Criterias are as follows:
- The long length of the red candle and the white candle shows us that there is more strength in the reversal.
- So if the red candle is a very large candle and the green candle is a very large candle that shows us that the reversal is imminent.
- The more indecision on the day of the doji shows us a better probability of a reversal.
- This means that the length will be the shadows of the doji candlesticks, which shows us it will be a much better chance to reverse and prices to start rising.
- So ideally we must see a very small gap between the open and close price and the shadows to be very large.
- A gap between the first day and the second day will give more chances of a reversal and a gap before and after the start day is also desirable.
- So the last criteria are that there always has to be a gap between the first day and the doji and third day.
- This is a very important criterion and these candlesticks should not overlap.
Examples of Morning Star Candlestick Pattern
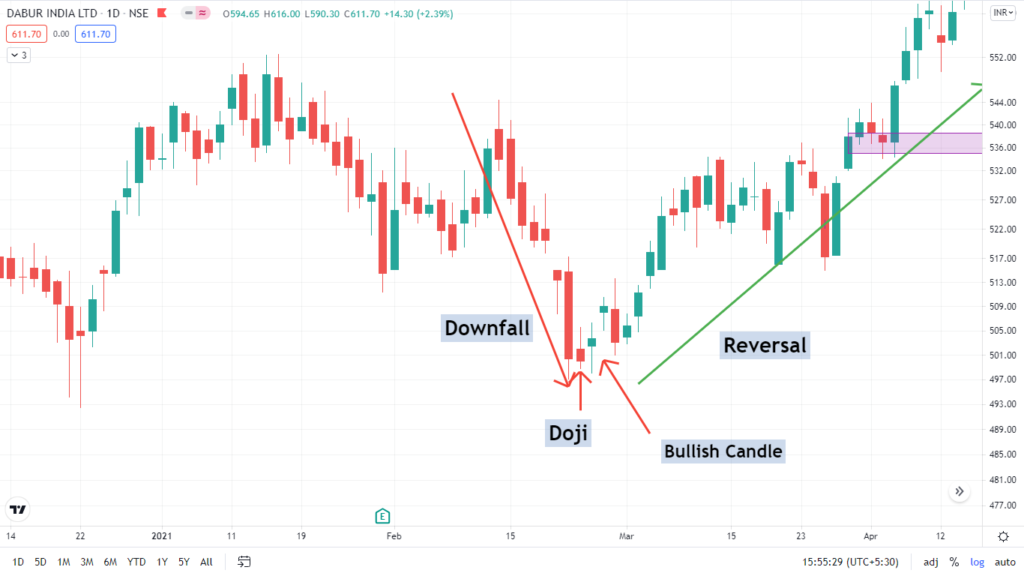
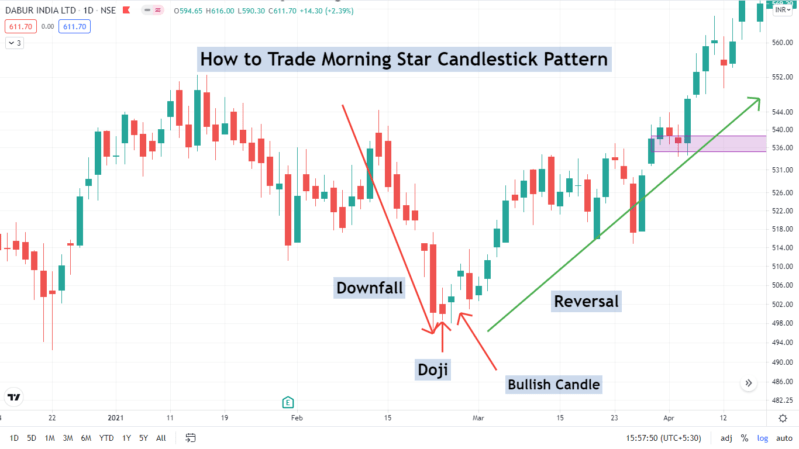
- Let us get into the practical applicability and see if you understood the pattern. This is the chart of Dabur, one of the leading FMCG companies in India.
- We can see there has been a downtrend. This is a good downtrend from February to the end of March.
- Prices start making new lows and at the end of the downtrend we see a very large red candle, so the first condition is a downtrend, it is satisfied.
- The second condition is the red candlestick and a very large candlestick.
- The third condition is there has to be a doji or a star needs to be formed and it should gap down which is being satisfied,
- and the open-close price is almost the same as you can see and there are very large shadows which show us that there is a lot of indecision on this day.
- The third day is a green candle and it is closing into the red candlestick which shows us that the reversal is imminent and all these candles are gapping.
- This candle is gapping down and the third candle is gapping up, so they are not overlapping.
- So all the conditions are satisfied and we have seen that the volume has also started rising, showing us that a reversal is imminent.
- We can easily enter the trade over here and if you have seen our previous module of the evening star, we can enter the trade at the morning star and we could have exited our trade at the evening star, which shows us that the first is a green candle.
- The second is a doji and the third is a big red candle and prices start to make new lows.
- So you can use these candles in conjunction to get a very good result of when to buy when to sell it, or when to hold.
Another Examples of Morning Star Candlestick Pattern
- Let us discuss another example so that you can get good clarity on Morning Star Candlestick Pattern.
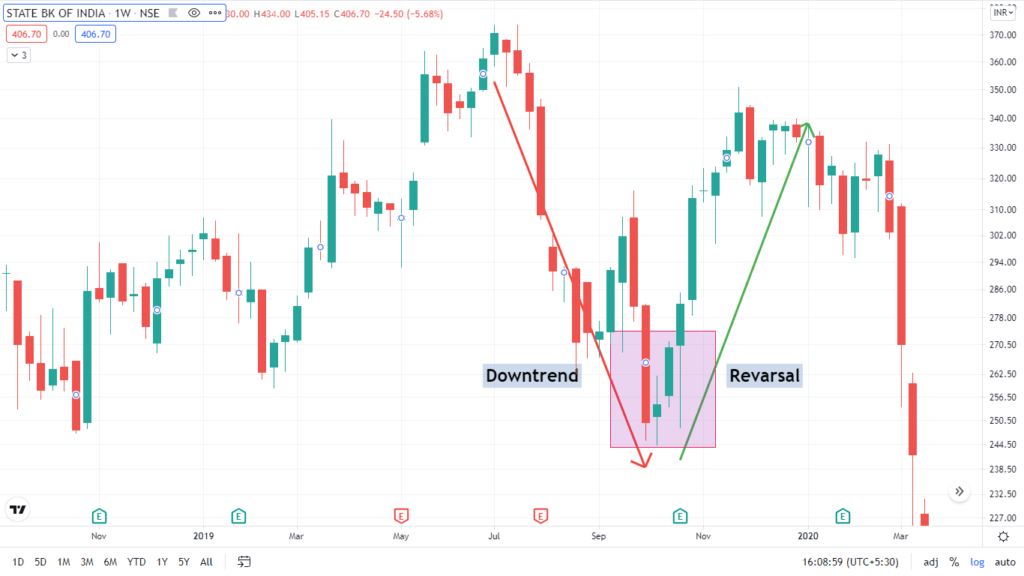
- This is a chart of the State Bank of India, one of the public and nationalized banks in the country.
- In this example, you can see that the trend has been downward in weekly chart
- So as I discussed there should be a major downtrend or a minor downtrend.
- In this example, there was a major downtrend.
- Our first candlestick was a red candlestick, a very big red candlestick.
- The second candlestick, which is gapping down is a doji that shows us indecision in the market.
- The third candlestick is green very large candlestick which is closing doji candle above which indicates that reversal is possible if next weekly candle starts trading above high of the previous weekly bullish candle.
- So all the conditions are being satisfied.
- A reversal is imminent and there is a very high volume on these days which is showing us that prices are going to make new highs so this is what the Morningstar is.
Make sure you see all our articles on candlestick patterns, so you can use them all in conjunction because you will be seeing or witnessing a lot of candlestick patterns, happening in the daily or the weekly charts or the hourly charts.
If you have good knowledge of these patterns, you can take a very informed trade and you can maximize your returns. I hope you liked the article.
One should follow the Risk Management, Money Management, and Fear and Greed concept of the market to avoid big losses.
If you like this post kindly leave a comment in the comment section so that we can know what your thought about this Morning Star Candlestick Pattern. For more trading ideas do follow us on

Nice article. Let’s discuss.