 by
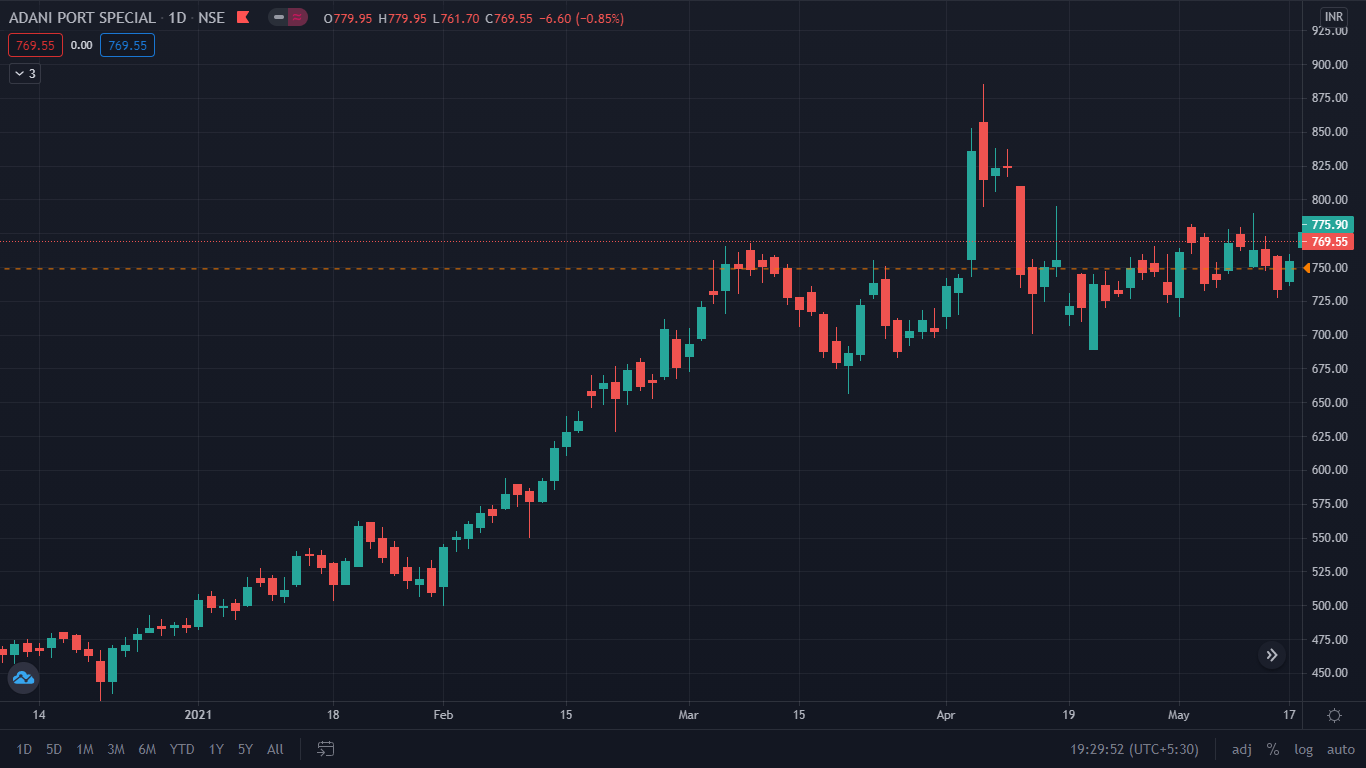
by Candlestick Trading is the most common and the most interactive form of charting tool which is used by day traders worldwide thus if you look at any trader’s screen you must have seen quite a few posts which are available on the online content.
You can see a six to seven screen and you see every screen having different sort of Candlestick Patterns for different products.
What do you understand about Candlestick Trading?
Every candle gives you certain information it talks to you in a certain way and tells you this is what the market looks like and this is the magic of candlesticks.
Now it is shaped like a candle and it gives you 4 important formations: the OHLC which means open price, high price, low price, and close price for the day. These are the four important pieces of information which are given by candlestick within the time frame which we chose to use.
Candlesticks can be plotted for various time frames like the minutes, hour, daily, weekly, monthly, and yearly basis.
You can have candlestick be plotted for every time frame which we chose to understand and which we choose to use. Now before understanding what exactly candlestick is first we have to understand.
How does the concept of candlestick trading originate?
So candlesticks are also previously called Japanese candlesticks and developed by a Japanese rice trader called Munehisa Homma about 300 years ago.
He used to understand the rice market and how to make trading strategies based on that. They soon got up and became very famous in the Japanese market.
They were introduced to the Western world. The concept of the candlestick was introduced to the Western world by Steve Nison in his book Japanese candlestick charting techniques and it caught up and became very popular in no time.
How to use Candlestick in Trading?
The candlesticks trading give you 4 different pieces of information, the first being open which means the opening price of the day in the green candle if you look the open is plotted at the bottom and the red candle if you see the opening is plotted on the top the close that is the closing price of the candle.
For a green candle, the open price is above the open price and for a red candle, the close price is below the open price.
The high is the maximum price achieved, that is the top of the candles on top of the wick in both red candles and the green candle is high for the day and similarly, the low for both the green candle and red candle is the low for the day.
These are the major components: the open price, the close price, the high price, and the low price of the candlesticks.
Each candlestick trading gives certain information about the market. Traders who are experienced and expertise in candlestick can actually predict the future and make a lot of profits based on that.
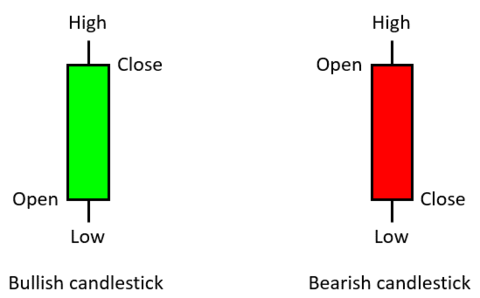
Bullish Candlestick
This is how a bullish candle looks like a bullish candle always looks green in color and what are the major understanding of it so when the close is higher than the open it usually means bullish candle.
A bullish candle can be a green candle or a white candle. The close of the candle is above the open of the candle which means the market opened here and closed above it which means it’s a green candle or a bullish candle.
What is the central body for a candle?
The body of the part which connects the close of the candle to the open of the candle this Central gain Part is called the central body of the candle.
What is the Upper Shadow in the candle?
The upper shadow of the candle is not a part of the body and it is above the close of the candle for the green candle. Refer chart to see the shadow of the green candlestick trading.
What is the Lowest Shadow in the candle?
The bottom part is below the open of the candle until the whole candle body whatever the remaining part is that is called the lower side of the candle.
Bearish Candle
A bearish candle is generally red or black by nature and the central body connects the open and close of the candle. The upper shadow connects the high of the candle to the opening of the candle. if you see it’s been plotted by us in this picture and the lower shadows connect the close of the candle to the low of the candle.
What is the basic anatomy of a candlestick?
So candlestick can belong green line or long red line so long body indicates heavy trading in one direction and a strong buying or selling pressure.
I’ll explain with a simple case if you look at this green candle here the open of the candle is here and the close of the candle is here and there is no major shadow formation is either side they are very small shadow which means in the long green candle the buyers are willing to buy at the high of the candle even the closing of the candle which means there’s a lot of bullish sentiment in the market.
Similarly, for a long red line that is a bearish candle, the selling pressure is so high that the sellers are willing to sell at the low of the candle and they are willing to pay the least price possible in the market, and still, they are expecting more losses in the price of the underlying asset in the days to follow.
What does the small body mean?
A small body is a candle that is slightly and indecisive by nature which means the body is small by nature and there’s a lot of buying and selling activity happening in the wicks. Sometimes the bulls are having the upper hand in the market and sometimes bears have the upper hand in the market.
The market is not able to decide which direction of the market is trying to head so that is the anatomy of candlesticks.
Why Candlestick Trading is so popular?
- Easy to Comprehend and Easy to Understand.
- Provides a detailed description of the occurrences and happening in the market and interaction between buyers and sellers.
- Helps us to understand the sentiment of investors and the values being determined by the market.
- Highly accurate tool in predicting the market trends.
Key Takeaways
- Candlesticks are the most common and interactive form of charting tool used by traders worldwide.
- The four important components while plotting charts are open, high, low, and close (OHLC).
- Green candles show strength in the market and the red candle indicates weakness in the market.
- Open<Close, it is a bullish candle.
- Open>Close, it is a bearish candle.
These are different basic candlestick patterns of the candle, and the various time frames can be used now this is very important. You can have a candlestick formation for the intraday charting trades.
You can also use the candlestick for long-term trades by plotting a weekly chart monthly chart daily chart and for short time you can plot one minute chart, 5-minute chart and make sense out of the price action within that time frame.
I hope this post gives you a basic understanding of the candlestick. In the upcoming, we will try to understand the various candlesticks patterns and how you use and interpret them for your trading activities.
if you like this post kindly leave a comment in the comment section so that we can know what your thought about these candlestick patterns. For more trading ideas do follow us on