

 by
by Day Trading Patterns is a regulatory designation for those traders or investors that execute four or more day trades over the span of five business days using a margin account.
The five most common bullish continuation patterns are Cup and Handle, Range-Breakout, Bullish Pennant, Bull Flag, and Rising Wedge.
In addition to candlestick patterns, day traders seek out powerful trend continuation patterns. Some of the world’s most consistent and profitable traders trade only these types of patterns.
Basic Day Trading Patterns Strategy
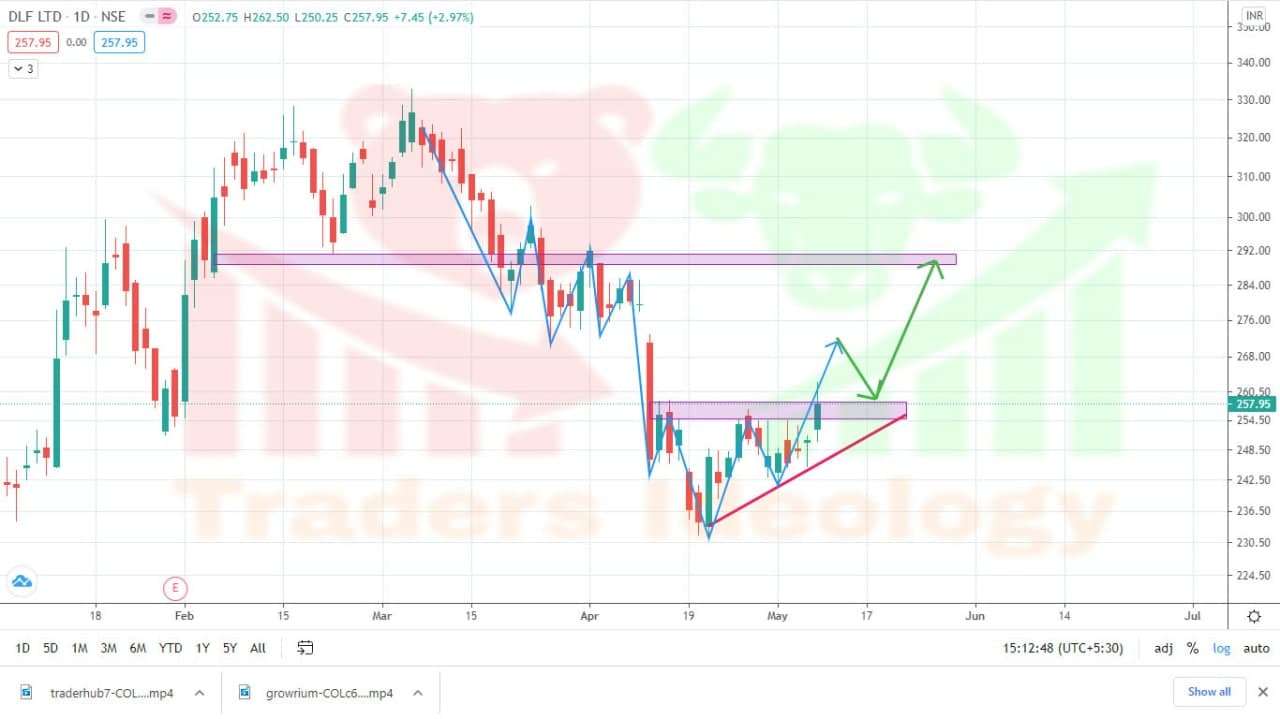
Support and Resistance
Somewhere price has changed direction repeatedly. A bullish move that turns bearish has met resistance.
A bearish move that turns bullish as met support. Support and resistance areas can last for minutes hours and days weeks and even years.
Support and resistance areas can be broken and when support breaks it will act as resistance and if resistance breaks it will act as support for the next time onwards whenever price comes to that zone then we can expect a pullback from there as shown in the chart.
Wedge
Wedge can be a kind of consolidation of the price. The wedge will usually have a trendline on the top and a trend line on the bottom and what you can notice about it is that there is a downtrend and upward trend and they are kind of converging and coming together.
Now what these signals remember when we talk about price action in my post. I always convey that price action is just understanding the market participants or story of the current price movements.
Similarly, we can see in wedge formation price is continuously and forth continuously and gets converged with a small narrow range (refer chart) so whenever this kind of formation, we can expect a good move in that stock on either side.
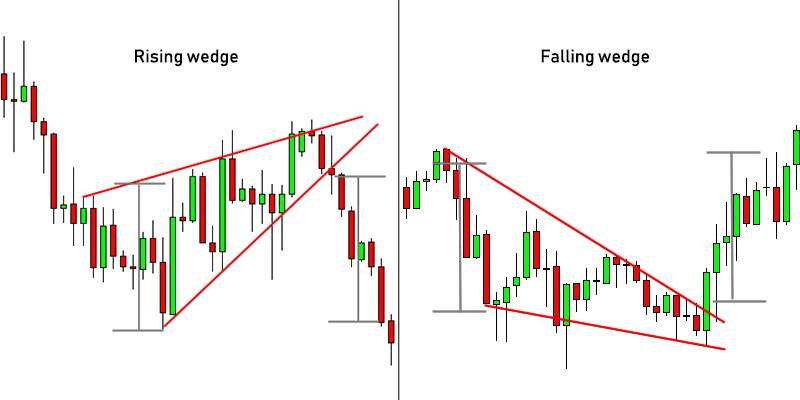
Wedge is of two types :
- Rising wedge
- Falling wedge
Rising wedge
A rising wedge formed after an uptrend usually leads to a REVERSAL (downtrend) while a rising wedge formed during a downtrend typically results in a CONTINUATION (downtrend). Simply put, a rising wedge leads to a downtrend, which means that it’s a bearish chart pattern.
The Rising Wedge is a bearish pattern that begins wide at the bottom and contracts as prices move higher and the trading range narrows.
In contrast to symmetrical triangles, which have no definitive slope and no bullish or bearish bias, rising wedges definitely slope up and have a bearish bias.
Falling wedge
The falling wedge pattern is a continuation pattern formed when the price bounces between two downward slopings, converging trendlines.
It is considered a bullish chart formation but can indicate both reversal and continuation patterns – depending on where it appears in the trend.
Cup and Handle
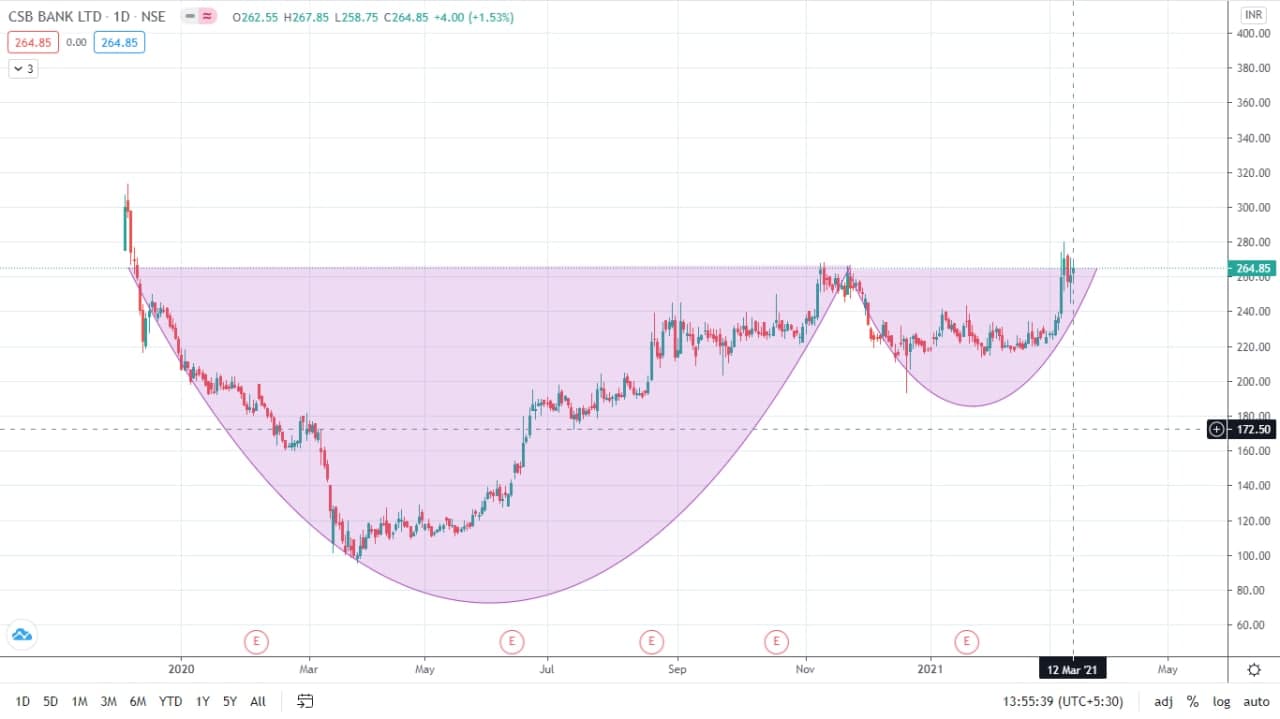
This Day Trading pattern is formed when the is the market is trending in a particular direction. When the retracement comes from a trend then we can see the formation of the cup and handle.
A cup and handle is a technical chart pattern that resembles a cup and handle where the cup is in the shape of a “u” and the handle has a slight downward drift.
The market never goes in a straight line direction it always pauses or gets retraced and forms some patterns then it will resume its trend or we can see a reversal trend.
Cup and Handle show a bullish signal extending an uptrend and is used to spot opportunities to go long.
how to take entry and exit what should be the target in a cup and handle pattern to learn more you can visit cup and handle pattern.
Range-Breakout
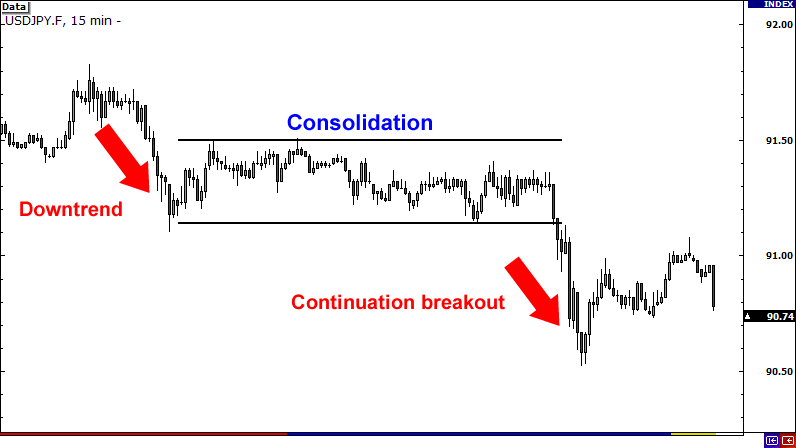
It one of the best patterns to trade in the market. Swing trading, day trading, and positional trading can be done easily through these day trading patterns.
These patterns are mostly used for breakout and breakdown of the range wherever it breaks we can see a strong breakout or breakdown with volume.
Range breakout patterns can give you good risk-reward ratios trade.
The most important thing about range trading is the breakout from the range.
- When the stock breaks the range upwards, then the price action is likely to continue in a bullish direction.
- When the stock breaks the range downwards, then the price action is expected to continue in a bearish direction.
Double Top and Double Bottom Pattern

Double top and double bottom are reversal chart patterns observed in the technical analysis of financial trading markets of stocks, commodities, currencies, and other assets.
One great criticism of technical pattern trading is that setups always look obvious in hindsight but that executing in real-time is actually very difficult.
Double tops and double bottoms are no exception. Although these patterns appear almost daily, successfully identifying and trading the day trading patterns is no easy task.
Conclusion
Day Trading Patterns for Beginners are usually a best trading patterns to take trade. This setup is very easy and simple to use just you need to keep patience and let your setup to form and then you can enter your positions. Stoploss should be the low of the candles and the target would be as per your risk-reward ratio. One should must follow the Risk Management, Money Management and Fear and Greed concept of market to avoid big losses.
if you like this post kindly leave a comment in the comment section so that we can know what your thought about these candlestick patterns. For more trading ideas do follow us on