 by
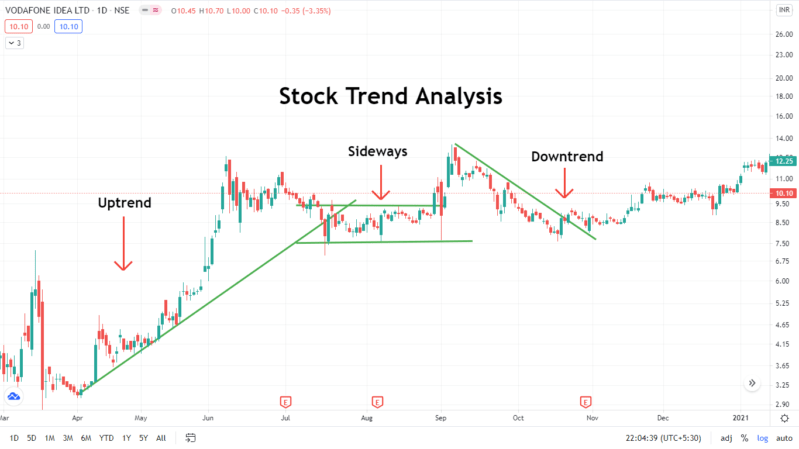
by In this post, we are going to focus more on trends rather than candles. So you can just imagine something like this that a lot of candles make a stock trend. Stock Trends Analysis is nothing more than a general direction that’s what I was talking about, a direction is nothing but it could be in the upward direction it could be the downward direction or it could be the sideways direction.
So the trend can be an upward trend or it could be a sideways trend or it could be a downward trend but before going on to these types of trends we have to understand
What is the meaning of a Stock trend analysis?
You can imagine something like this that today’s open high/low/close. I plot on one candle next is open high/low close. I say I plot almost twenty days in a row with help of a candle I am sure these twenty days these 20 candles are going to form some sort of a pattern. so this could be in an up move or it could be a down move.
So whenever I make a lot of candles one after the other it could be a collection of up moves and a collection of down moves, such a collection is a Stock Trends Analysis.
How Stock Trends Analysis is defined in financial terms?
The meaning of Stock Trends Analysis in finance isn’t all that different from the general definition of the term trend a trend is nothing more than a general direction that’s what I was talking about, a direction is nothing but it could be in the upward direction it could be the downward direction or it could be the sideways direction.
But the important point which I told you is that trend is nothing but a combination of a compilation of various up moves and various and down moves right.
For example, we even do see trends while watching IPL matches so you can see here that in IPL matches you can see that this is this was a score after 15 overs so this can be the predicted score after 20 overs.
What is that that’s a trend or you can see some of you know if you can see that India vs.Pakistan let us say so how in which way the scoreboard is going on at the end of 10 overs who was at which no place that’s nothing but a trend. so it has not got a very different meaning in stock markets.
I hope you have understood the simplest meaning of our trend. So let’s talk about the types of trends in a little bit of detail.
Types of Stock Trends Analysis
- Uptrend
- Downtrend
- Sideways
Uptrend Stock Trends Analysis

You can easily see it on the screen that here the stock prices are moving up up up is it like a continuous up move no never it’s about to be a few ups little bit or down.
So sometimes they’re gonna go up it’s going to go down in fact if you can see a continuous uptick there’s got to be a little bit dicey a question mark maybe someone is trying to play into that stock ok so it’s always good if the stock moves in a little bit of upward up little bit of downward direction.
Overall it’s very clearly visible to our eyes as well overall the price is going up and up and up and up. so this is an uptrend I hope that was a lot of explanation for up-trend
Downtrend Stock Trends Analysis
The downtrend now downtrend is nothing but one again it’ll be very clearly visible the share price was at this level it’s going down a little bit up big fall again a little bit of recovery a lot of down moves and up move down move and finally, you can see here if I just try to connect all these dots on the tops if all the high.
So again as I said it’s easily visible to our eyes over all the highs of the stocks are going down right and the lows are also going down so basically a downtrend is like lower highs and lower lows whereas the uptrend was higher highs and higher lows hope uptrend downtrend both clear now let’s move on to a sideways trend.
Sideways Stock Trends Analysis

Trend you can see here this is sideways trending so it’s you’re up moving is restricted whatever you want to jump you can jump in this between these two lines that are like a sideways trend.
So here you can see the stock is moving in a very particular price direction I can say it is not breaking this level significantly neither it is breaking it down downward significantly.
So this is a very simple example of a sideways trend hope all three types of trend in simple words you have already understood. so we’re going to talk about how to trade in what type of trends.
How to Trade the Stock Trends Analysis with Example

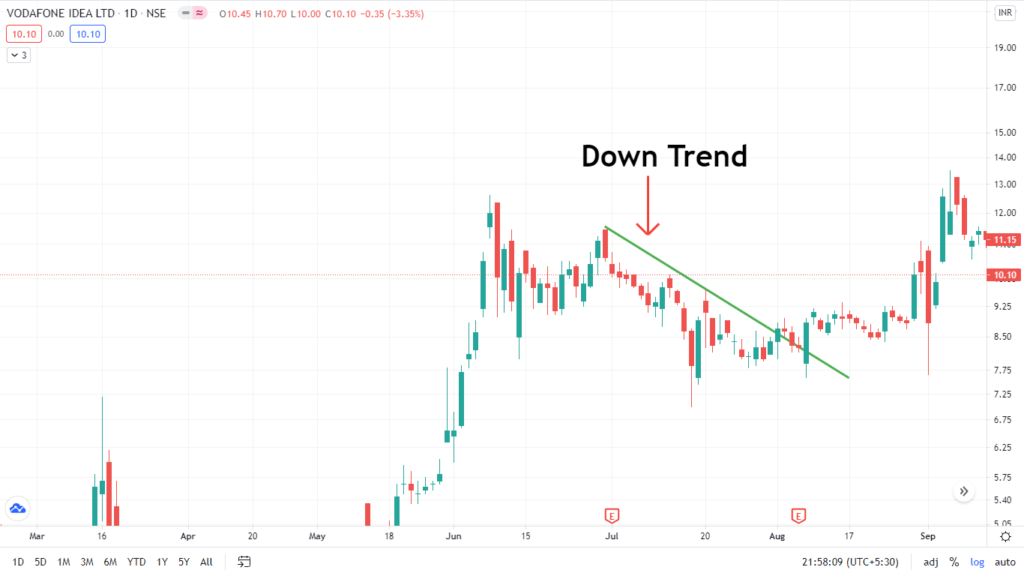
Let’s consider one of your favorite stocks I know that and that is the idea. here I want you all to just have a look at the entire screen and tell me which type of trend do you think is correct it’s a downtrend so anyway as I said it’s very clearly visible to our eyes as well in the above charts. You can see a drawing this simple line.
So it’s very clearly visible in the chart that the entire stock is going through a clear-cut downtrend right so what should be our strategy in a downtrend it’s very simple just remember the sentence “Never catch a falling knife”.
If a knife is falling and if you are trying to catch it your hands are going to bleed the same way if you can see a continuous downtrend it’ll stop in any stock what people do the stock is falling here at this price you will try to average then it falls further then we’ll say our leverage again.
It falls further than you’ll say average again and you always try to console yourself that good my average price is now down but every single time you are consoling self the price is going to go dig down further.
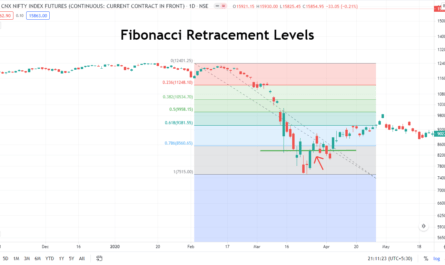
So what should be our strategy never buy in a downtrend I hope this is very clear now if I were to zoom into ideas stock at this time frame it is somewhere between here you can see on the chart August 2 may be mid-October almost one and a half month which type of trend can you see here this one again.
I need not draw any line as well I think it’s very clearly visible to you it’s a clear-cut example of a sideways trend. so here you can see a sideways trend the whole idea is generally to avoid investing in any sideways trend because you never know where is it going to go to either it can break down or it can break out.
So the key here is to wait and watch till it either goes outside this upper band or it goes below this lower band so this is generally called support whereas this is called resistance.
But right now if you see at the current level the stock is pretty much close to its resistance right here you can see that many times the stock has tried to test these levels and currently it is at this level so now the interesting theory would be to check where is it going is it breaking it in the upward direction.
It is the stock might see a recovery this could be a potential buy call please understand just by looking at the support and the resistance and the trends this is not the only way to either buy or sell a stock you need to check other indicators as well this can give you a hint whether I should go ahead and buy or not so let’s now talk about the uptrend.
I have already opened up this HDFC AMC chart for you again very clearly visible I have also drawn a trendline for you it’s a very clear-cut case of an uptrend. so what should be you are taking an uptrend ideally you should go ahead and buy in an uptrend the more and more highs it is making higher highs it is making it is and the meaning is that the stock is in a very good area.
There are great chances that the stock can still wood and make new and fresh highs so people feel that let’s say you are at this level right now people feel that it is already at almost like a lifetime high or something like that.
I should not go ahead and buy but there is absolute strength in the stock right now unless and until you don’t see any reason for this stock falling you can go ahead and buy in an uptrend the only thing is that how high are you have it already made five-six new highs if that be so then again making a seventh new high or an eighth high consecutively.
It’s a little bit tricky but if you are at the second or third high again potentially there is a chance that it could be making fresh eyes.
Conclusion
Stock Trends Analysis for day trading is usually the best trading strategy to take the trade. This setup is very easy and simple to use just you need to keep patience and let your setup form and then you can enter your positions. Stoploss should be the low or high of the inside bar candle for uptrend and downtrend and the target would be as per your risk-reward ratio. One should follow the Risk Management, Money Management, and Fear and Greed concept of the market to avoid big losses.
if you like this post kindly leave a comment in the comment section so that we can know what your thought about this Stock Trends Analysis. For more trading ideas do follow us on