 by
by In this article, we will be discussing How to trade the Hammer candlestick pattern. I’m presuming that you’ve already read our article about the morning star, evening star, Shooting Star & Doji Candlestick Patterns. If you have not read those articles, after reading this article you can read those articles too.
Today we’ll be discussing the Doji Candlestick Pattern which is the most powerful candlestick pattern. It is a single candlestick pattern and it signifies that there has been a dramatic reversal in the prices. Doji is a sign of bending the ongoing trend of the market.
This is one of my favorite candlestick patterns because it tells us so much about the psychology of the buyers and the sellers and it is such an effective pattern.
What is a Hammer Candlestick Pattern?
- Hammer Candlestick Pattern is a kind of bullish pattern. Bullish patterns can form after a market decline and can signal a reversal of price movement. They are an indicator for traders to take long positions so that they can make profits.
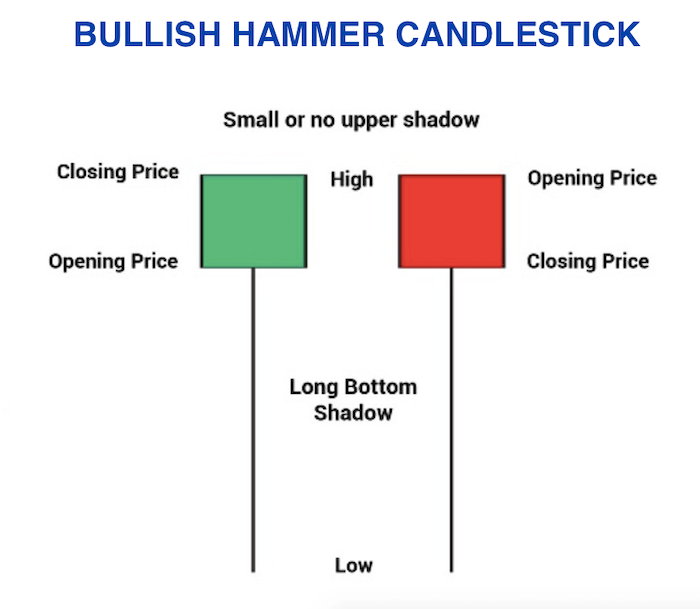
- The Hammer candlestick pattern is formed by a short body with a long lower wick and is found at the bottom of a downward trend.
- A hammer candlestick is a specific candlestick pattern that indicates a potential trend reversal. Since it is formed with a downtrend, traders tend to associate the hammer with the return of a bullish trend in the market.
- This is a small green candle with an elongated lower shadow, which signifies the rejection of the short price by the market.
- The Bullish Hammer is more common, but traders also recognize another hammer-like formation they call the Inverted Hammer Pattern.
There are two types of PAPER UMBRELLA
- BULLISH PAPER UMBRELLA – This is POPULAR in the name of HAMMER.
- BEARISH PAPER UMBRELLA – Which IS POPULAR in the name of HANGING MAN.
Benefits of Hammer Candlestick Pattern (PAPER UMBRELLA)
- From the PAPER UMBRELLA, we get to know the directional trend of the trade.
- The Paper Umbrella is a TREND REVERSAL indicator pattern.
- The paper umbrella tells directly whether the market is going to go down or up.
- Bullish Paper Umbrella i.e. HAMMER tells us the possibility of further market being BULLISH, while its previous trend is DOWN TREND.
- Bullish Paper Umbrella i.e. HANGING MAN gives us the possibility to BEARISH the market ahead, while its previous trend is UPTREND.
Now we will try to understand both the paper umbrella candle alternately by different names,
- PAPER UMBRELLA or HAMMER
How is the HAMMER candle pattern formed?
- PAPER UMBRELLA or HAMMER is formed when a stock is in DOWN TREND, and one day i.e. on the day the HAMMER is formed, the stock goes down from its OPEN PRICE, which is in the BEARISH TREND of the stock, but then BUYER in the stock on the same day (BULLS) increases.
- And by getting good supply from the side of bulls, the closing price of the stock becomes around its open price, and thus a hammer candle starts appearing in the chart.
Effect of PAPER UMBRELLA or HAMMER –
- Let us now talk about what is the effect of HAMMER on the market,
- After showing the paper umbrella i.e. HAMMER in DOWN TREND, it is expected that now REVERSAL can come, and the market will change its direction from Bearish to Bullish.
Identity of PAPER UMBRELLA or HAMMER
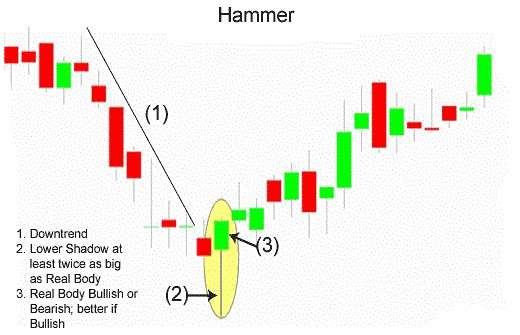
- Before becoming HAMMER the stock should be in DOWN TREND,
- If we talk about the BODY of the HAMMER candle, then there is a SMALL REAL BODY and a LONG LOWER SHADOW,
- The COLOR of the candle is not very important, but the RATIO of the stock should be in the ratio of 1:2 between a SMALL REAL BODY and a LONG LOWER SHADOW in the back TREND and CANDLE BODY.
- The REAL BODY of HAMMER i.e. OPEN PRICE and CLOSE PRICE of the candle should be between 1% to 2% difference,
- And the LOWER SHADOW of HAMMER should be twice or more than the REAL BODY.
TRADER ACTION PLAN OVER HAMMER
Hammer is a Bullish candle so, we should keep our position long on the hammer candle, we should BUY stock, and after achieving our TARGET, either we can square off our positions or we can trail our stop loss.
How to trade Hammer candlestick pattern
- If you are a risky trader then you can take trade immediately with the Hammer candlestick pattern confirmed, and if you are not a risky trader then you can take the trade with double confirmation when the next candle is bullish after the Hammer candle is formed,
- Trade Setup can be like this:
BUY PRICE = CLOSE PRICE of HAMMER.
STOP LOSS = LOW PRICE of HAMMER.
TARGET = You can set the target according to your RISK MANAGEMENT.
NOTES: If you take any trade then three things can happen.
- The market can be bullish according to your thinking – You must book your profit after seeing the right time.
- The market may be bearish against your thinking – and if your stoploss is getting hit, then EXIT from TRADE.
- If the market is sideways, you can wait and have an eye on your trade.
Example of Hammer Candlestick Pattern
It has given me such good results over the past. So let us get started!
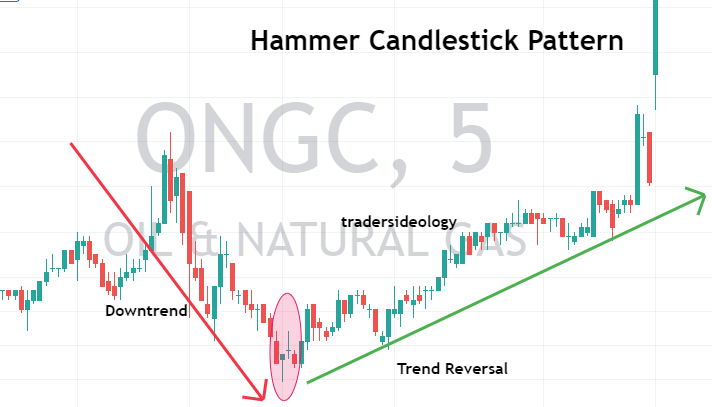
Hammer is a 1 candlestick pattern and it is basically a reversal pattern. I will just show you on the charts what it looks like. This is the daily chart of the Oil and Natural Gas Corporation of India listed on the National Stock Exchange.
What happens is that there has been a prior downtrend. Stock prices have been falling drastically from 167 levels and it has come down to 132 levels. At the end of a downtrend, I am going to see a hammer candlestick and after the hammer candlestick, we are going to see a new uptrend i.e. a rise in the prices.
As I’ve already indicated, a hammer is nothing but a 1 candle pattern and it marks a reversal in the downtrend. So, it will always occur at the trough or the bottom of the downtrend indicating a rise in the prices. The basic characteristic is that there will always only be a lower shadow of the hammer candlestick and there will be no upper shadow or if there is an upper shadow it will be very small.
What I mean is that for the hammer candlestick there will be a very small body and there will be a very long lower shadow and this lower shadow will be at least twice the length of the body. That is the basic prerequisite for a hammer candle to work.
If there is a foreshadow it has to be very small or it should not be there as simple as that.
The real body, the body of the candle should be at the upper end of the trading range because at the lower end of the trading range there will be a very long shadow and the color will not be important i.e. can be green or can be a red. It is not important and confirmation must be followed i.e. the next day should open higher or should give us a bullish day for confirming or enhancing our reversal.
So if you look at this example as we’ve already indicated, there has been a fall in the prices and at the end of the downtrend, we see a hammer candlestick. So, for it to turn true it has a small body and has a very long lower shadow and a negligible upper shadow and this lower shadow is at least twice the length of the body and the next day it is opening higher or it is gapping up. So this shows that a reversal is imminent.
I could have entered the trade anywhere around this time and I could have got a very good profit.
Confirmation of Hammer
Let us study the confirmation signals before that. The longer the lower shadow will be, the higher will be the chances of a reversal. If the lower shadow is longer than two times the length of the body, it is a very good signal to trade.
(Number two:) There has to be a very large volume on the hammer day. The higher the volume, the higher will be the chances of a reversal and
the buyers coming in place of the sellers.
And third condition: The following day of the hammer must open higher or as we saw in the earlier example it must gap up. So that is a very important condition.
Conclusion
- Hammer Candlestick Pattern for day trading or swing trading are usually the best trading patterns to take the trade.
- This setup is very easy and simple to use just you need to keep patience and let your setup form and then you can enter your trades.
- Stoploss should be low or high of the previous swing for uptrend and downtrend and the target would be as per your risk-reward ratio.
- One should follow the Risk Management, Money Management, and Fear and Greed concept of the market to avoid big losses.
- Make sure you see all our articles on candlestick patterns, so you can use them all in conjunction because you will be seeing or witnessing a lot of candlestick patterns, happening in the daily or the weekly charts or the hourly charts.
- If you have good knowledge of these patterns, you can take a very informed trade and you can maximize your returns.
- If you like this article kindly leave a comment in the comment section so that we can know what your thought about this Hammer Candlestick Patterns.
- I hope you understand the Hammer Candlestick Patterns of technical analysis very well.
- For more trading ideas do follow us on