 by
by In this article, we will be discussing the Doji Candlestick Patterns. I’m presuming that you’ve already read our article about the morning star, evening star & Shooting Star. If you have not read those articles, after reading this article you can read those articles too.
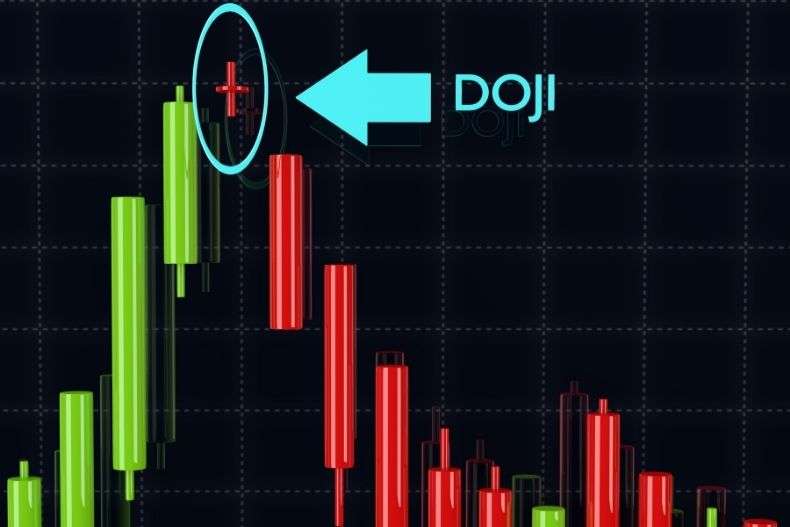
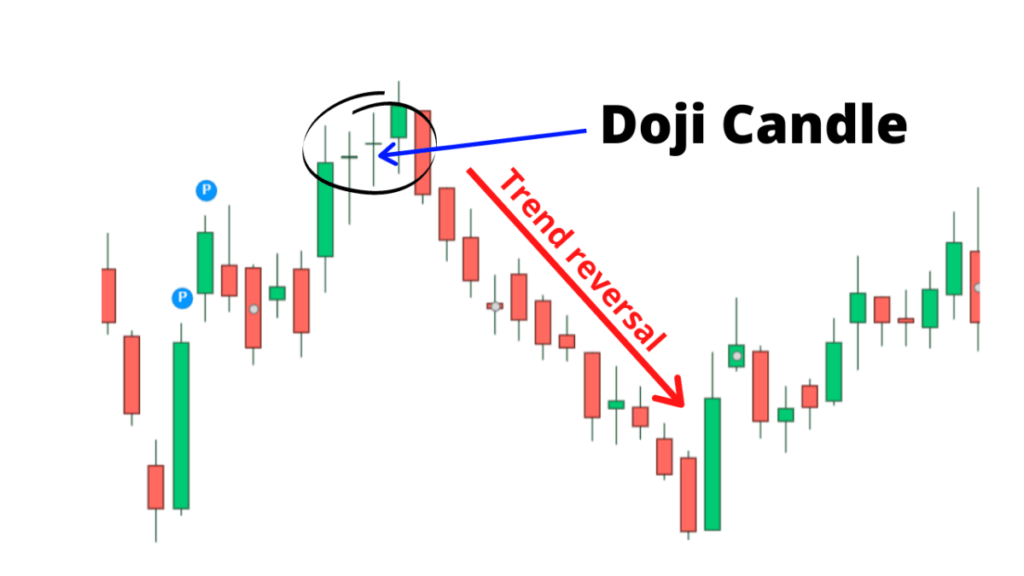
Today we’ll be discussing the Doji Candlestick Patterns which is the most powerful candlestick pattern. It is a single candlestick pattern and it signifies that there has been a dramatic reversal in the prices. Doji is a sign of bending the ongoing trend of the market. So let us get started.
What is Doji Candlestick pattern?
Doji is a very important candlestick pattern. It is a single candlestick pattern, which neither confirms Bullish Trend, nor Bearish Trend, but the Doji candle acts like a speed breaker to keep a short pause while the market moves in uptrend or downtrend.
How Doji Candlestick Forms?
Doji candle forms when STOCK OPENING PRICE and CLOSING PRICE are both equal or not (0.5% or even less than that).
There is a small difference but a lot of difference between LOW PRICE and HIGH PRICE of stock.
Identification of Doji Candle
1. Whether TREND was there before the doji was created, i.e. the previous TREND is not important,
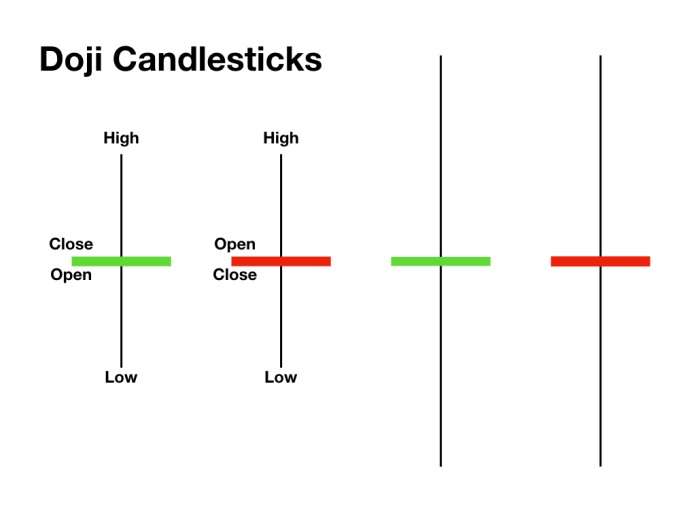
2. A very short line or a very small non-existent REAL BODY and Consists of LONG UPPER and LONG LOWER SHADOW,
(Doji being a line-like REAL BODY indicates that both OPENING PRICE and CLOSING PRICE of stock are equal or almost equal).
(Doji’s UPPER AND LOWER SHADOW of a stock which is Indicates WIDE RANGE PRICE MOVEMENT OF STOCK).
- COLOR OF DOJI CANDLE IS NOT THAT IMPORTANT, IMPORTANT IS JUST THIS CANDLESTICK PATTERN IDEALS INDECISION i.e. Uncertainty in the market anything can happen, the market may go up or down.
What is the Impact of Doji Candlestick on the Market?
The Impacts of Doji Candlestick Patterns on the Market are as follows:
Impact of Doji in BULLISH TREND
If Doji Candlestick comes in a bullish TREND, it may have two effects, either short CORRECTION, the BULLISH TREND will remain or it may be that due to doji candlestick the BULLISH TREND of MARKET may break, and the market will go down.
Effect of Doji in BEARISH TREND
If Doji comes in BEARISH TREND, then it can have two effects, either after some CORRECTION the BEARISH TREND will remain, or it may be that the BEARISH TREND of MARKET may be broken due to Doji, and The market can go up.
Doji in the SIDEWAYS TREND
After seeing the doji candlestick can also do a little correction, and in some sessions, it can also be sideways, by looking at the doji candle we have to understand that the doji is a SPEED BREAKER, which allows us to stop the market for a while. Seeing the next move gives a message to proceed accordingly.
Advantages of Doji Candlestick Patterns
Doji and Spinning Top Candle: These are both such single candlestick patterns, which have the same effect, both of them indicate uncertainty in the candle market, so we can say that doji is such a candlestick pattern, which does not clearly convey what is going to happen in the market, rather it gives us a message to proceed with caution after the doji candle comes, the market can go up and down, while Doji appearing in the trend, we should be careful while initiating our trades.
How to trade Doji Candlestick Patterns?
When the doji is seen, then we should understand that no TREND in the market can be considered fixed, i.e. there is no CLARITY about the fluctuations in the market after the doji. Therefore a trader should do this:
- If trader wants to take trade, then trade can be initiated in half quantity, rather than full quantity.
- Trader needs to have patience till a new trend is formed in the market.
Example of Doji Candlestick Patterns
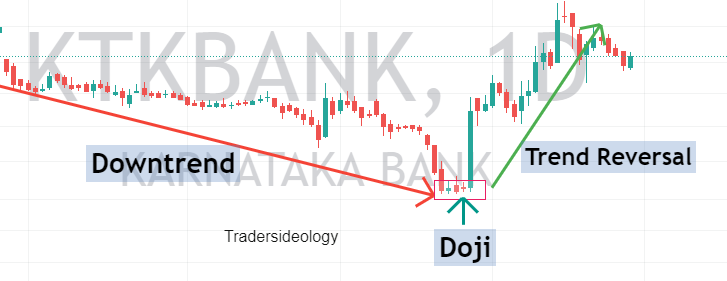
- Let us get into the practical applicability and see if you understood the pattern. This is the chart of Karnataka Bank, one of the Public banking sector banks in India.
- We can see there has been a downtrend. This is a good down trend from June 2021 to the mid of August 2021.
- Prices start making new low and at the end of the downtrend we see a Doji candlestick patterns.
- The price is consolidating as shown in above chart and forming a doji candlestick in the downtrend.
- Price consolidation with doji candle indicating that trend reversal may occur from this levels as the buyers are trying to defend this levels continously as shown in above chart,
- Then we can see a good reersal has come from those consolidation levels as shown in the above chart.
- So all the conditions are satisfied and we have seen that the volume has also started rising, showing us that a reversal is imminent.
- We can easily enter the trade over here and if you have seen our previous module of the hammer candlestick patterns similar as doji candle, we can enter the trade at the doji candlestick patterns in down trend and we could have exited our trade at the doji candlestick or shooting star candlestick patterns, which shows us that the reversal may occur from this candle.
- Buyers may come and push the price up from this shooting star candlestick patterns so its better to book some profits and trail stoploss cost to cost.
- So you can use these candles in conjunction to get a very good result of when to buy when to sell it, or when to hold.
NOTES: If you take a trade, Buy or sell stocks on the basis of the candlestick patterns, then you have to wait for your target price, and if your stop-loss is hit, then you must exit that trade and try to find another good risk-reward opportunity int the market. If you do not do this, then you are not following the technical analysis, you are doing something else.
Conclusion
- Doji Candlestick Patterns for day trading or swing trading are usually the best trading patterns to take the trade.
- This setup is very easy and simple to use just you need to keep patience and let your setup form and then you can enter your trades.
- Stoploss should be low or high of the previous swing for uptrend and downtrend and the target would be as per your risk-reward ratio.
- One should follow the Risk Management, Money Management, and Fear and Greed concept of the market to avoid big losses.
- Make sure you see all our articles on candlestick patterns, so you can use them all in conjunction because you will be seeing or witnessing a lot of candlestick patterns, happening in the daily or the weekly charts or the hourly charts.
- If you have good knowledge of these patterns, you can take a very informed trade and you can maximize your returns.
- If you like this article kindly leave a comment in the comment section so that we can know what your thought about this Doji Candlestick Patterns.
- I hope you understand the Doji Candlestick Patterns of technical analysis very well.
- For more trading ideas do follow us on