 by
by In this article, we will be discussing the Marubozu Candlestick Patterns. I’m presuming that you’ve already read our article about the Morning Star, Evening Star, Shooting Star & Doji Candlestick patterns. If you have not read those articles, after reading this article you can read those articles too.
Today we’ll be discussing the Marubozu Candlestick Patterns which is the most powerful candlestick pattern. It is a single candlestick pattern and it signifies that there has been a dramatic reversal in the prices. Doji is a sign of bending the ongoing trend of the market. So let us get started.
What is Marubozu Candle?
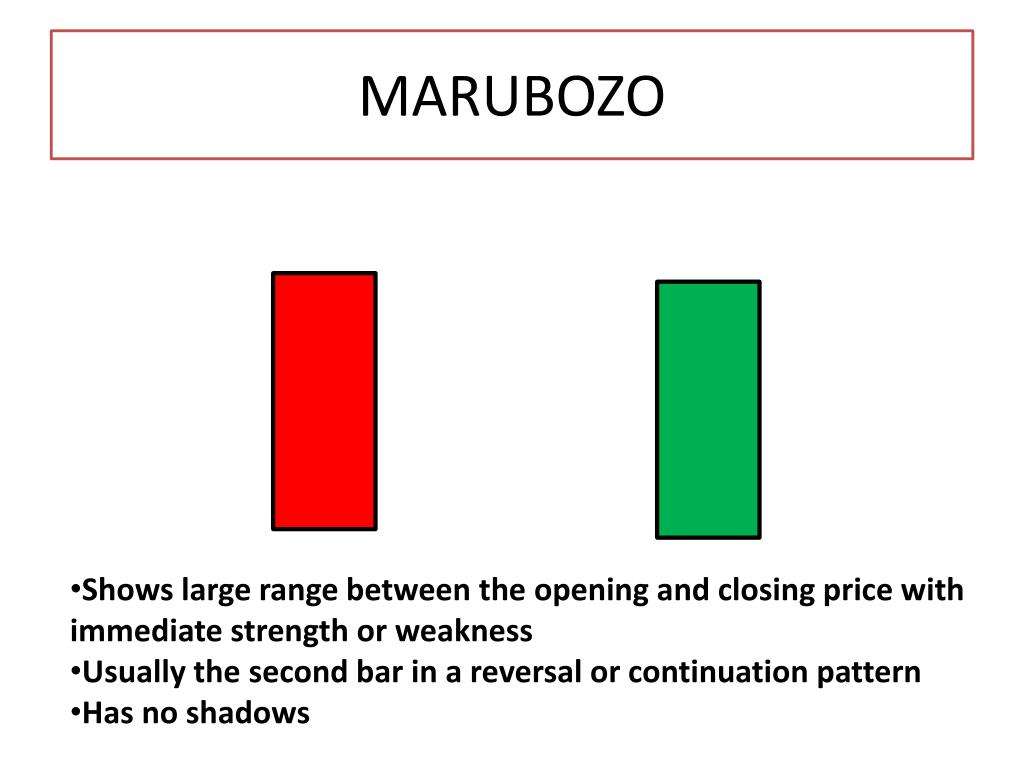
- Marubozu is a single candlestick pattern and a very important candlestick pattern.
- In the Japanese language, the word “Marubozu” means “Bald”.
- Deriving from that, a perfect marubozu means a candle with no upper or lower shadow. It will only have a real body.
- A marubozu candle can be of two types – the bullish marubozu and the bearish marubozu.
- This pattern is a strong indication of trend reversal or trend continuation depending on where it appears.
Benefits of Marubozu Candlestick
- Marubozu’s biggest advantage is that, from the Marubozu pattern, we can identify the performance of a stock in the market, also we get a clear-cut trend of the stock.
- With Marubozu Candlestick, the trend of the market can be detected very accurately, whether the market will go up or down, we just need to know how to identify the Marubozu candle correctly.
Identification of Marubozu Candlestick Patterns
- Marubozu Candle can appear anywhere in the chart,
- what was the TREND before the formation of Marubozu, that is, the previous TREND is not important,
- the identity of Marubozu is that Marubozu candle has only REAL BODY,
- it’s LOW (LOWER SHADOW) Or HIGH (UPPER SHADOW) is not there, even if there is very little LOWER SHADOW or UPPER SHADOW, it can still be called Marubozu.
There are two types of Marubozu Candle
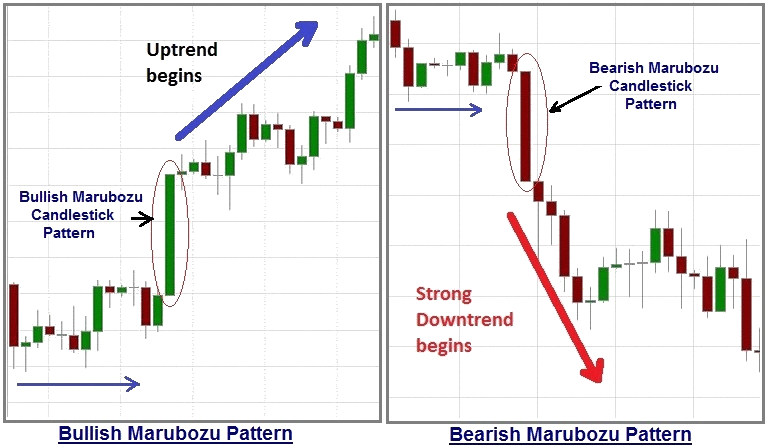
1. Bullish Marubozu Candle
- When the Color of the Candle is Green i.e. Bullish, then we call Marubozu or Bullish Marubozu Candle.
- It’s exactly the opposite of the Bearish Marubozu Candlestick Patterns.
- When a Bullish Marubozu (large green candle) appears on the charts, it’s a sign of bullishness.
- A Bullish Marubozu gets formed when the price opens at a certain level, rise, and closes strongly. The bulls are in complete control of the stock.
- A big investor or some institution could’ve initiate their long position in the stock.
- This can also happen if there is good news related to the company or if a company announces financial results that are above expectations.
If Bullish Marubozu is formed in the chart So what does this mean?
If Marubozu is a Bullish Candle then it means, in the time frame in which Marubozu candle is made, all the sellers i.e. Bulls have been strongly influenced in that trading session, and people can buy the shares at that price.
2. Bearish Marubozu Candle
- When the Color of the Candle is Red i.e. Bearish, then we call it Marubozu or Bearish Marubozu Candle.
- It’s exactly the opposite the Bullish Marubozu Candle.
- When a Bearish Marubozu (large red candle) appears on the charts, it’s a sign of bearishness.
- A Bearish Marubozu gets formed when the price opens at a certain level, falls and closes weakly. The bears are in complete control of the stock.
- A big investor or some institution could’ve cut their position in the stock.
- This can also happen if there is a bad news related to the company or if a company announce financial results that are below expectations.
If Bearish Marubozu is formed in the chart So what does this mean?
If Marubozu is a Bearish Candle then it means, in the time frame in which Marubozu candle is formed, all the sellers i.e. BEARS have been strongly influenced in that trading session, and people can sell the shares at that price.
How to trade Marubozu Candlestick Patterns
- Depending on the color of the candle, it simply means that either the buyers or the sellers got full control of the market.
- Depending on the type of Marubozu, the trading style will be different. We will now discuss how to trade with both Bullish Marubozu and Bearish Marubozu.
- But in either case, you should wait for another confirmation candle or pattern before entering into a trade.
Trades with Bullish Marubozu Candle
The absence of the upper and lower shadow in a Bullish Marubozu Candle means that the low price is equal to the open price and the high price is equal to the close price. Hence whenever we see a candle with Open = Low and Close = High, we can call it a Bullish Marubozu Candle.
A Bullish Marubozu points that there is so much buying interest in the stock (or instrument) that the market participants were willing to buy the stock at every price point during that session. Therefore the price of the stock closed near its high point for that session.
If the Bullish Marubozu appears in an uptrend it strongly implies a trend continuation. But while appearing in a downtrend, it indicates a trend reversal, that the market’s sentiment has changed and the stock is now bullish.
The expectation is that with this sharp change in sentiment there will have a surge of bullishness and the same will continue over the next few trading sessions. Hence a trader should look for buying opportunities after the occurrence of a bullish marubozu. The suggested buy price is a little above the closing price of the marubozu (Bullish Breakout).
Bullish Marubozu Candle Trade Setup
It does not matter if a stock is in a downtrend or uptrend, when a Bullish Marubozu (large green candle) appears on the chart, it’s considered to be a very bullish sign. And that’s why we should buy the stock. And our position should be LONG.
- BUY PRICE – BULLISH Marubozu CANDLE around the CLOSING PRICE
- STOP LOSS – BULLISH Marubozu around the CANDLE to LOW PRICE
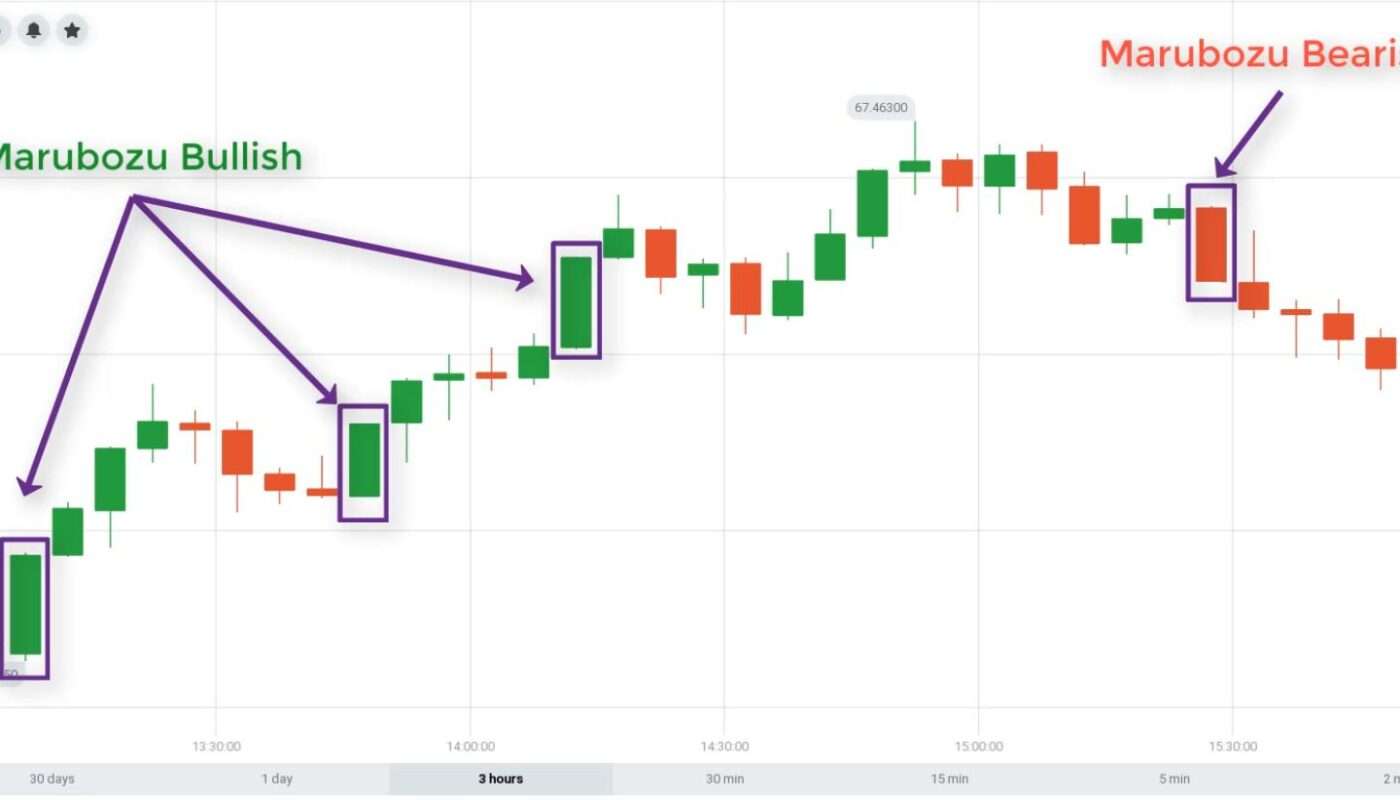
Example of Bullish Marubozu Candle
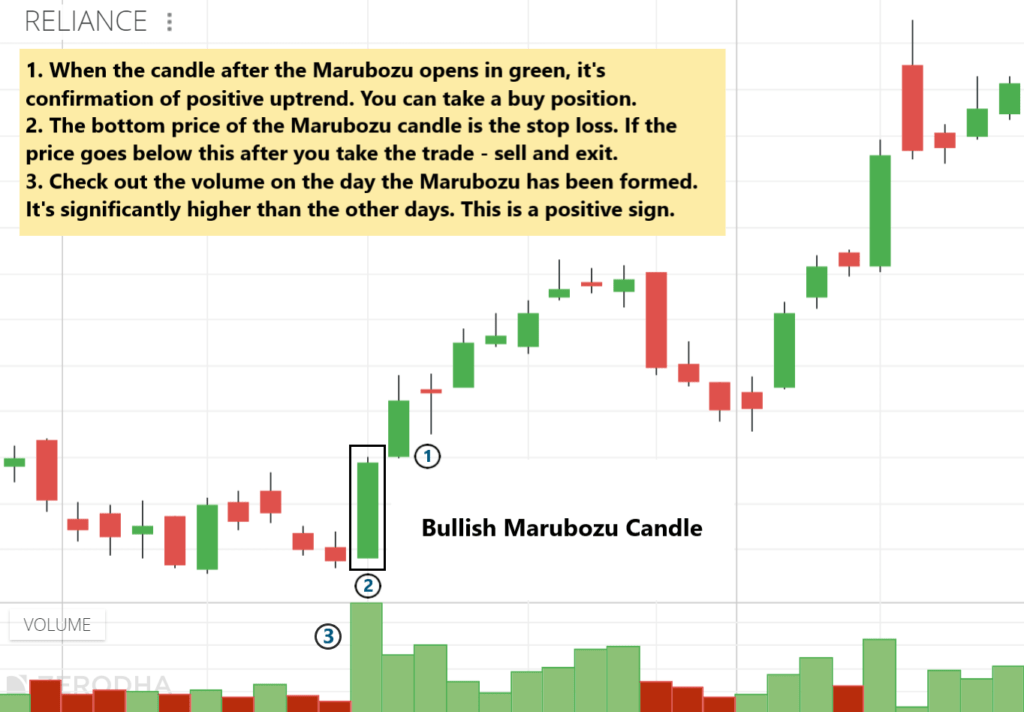
- The above chart is of Reliance Industries. The stock formed a ‘Bullish Marubozu’ candle.
- It was an extremely bullish candle. Take a look at the volume on that day. It was significantly higher than the last few days – almost 9 times the volume compared to the previous day.
- If you took a buy position there, you would be still holding the stock – as the price has never fallen below that Marubozu candle.
- The price was 678 on that day and today Reliance is quoting 1431.
- Obviously, holding the stock for such a long period of time is extremely difficult for traders with a short-term view – especially when the trailing stop loss can get hit quite frequently.
Trade with Bearish Marubozu Candle
A bearish marubozu candle suggests extreme bearishness in the market. Here, that the high price is equal to the open price and the low price is equal to the close price. Hence whenever we see a candle with Open = High and Close = Low, we can call it a bearish marubozu candlestick patterns.
A bearish marubozu signifies that the sellers are in absolute control of the market. There is so much selling pressure in the stock (or instrument) that the market participants are willing to sell the stock at every price point during that session. Therefore the price of the stock closed near its low point for that session.
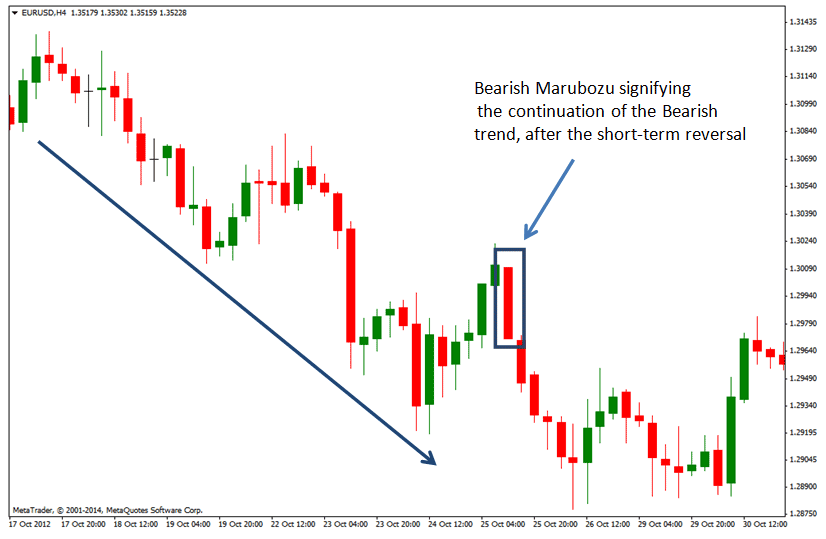
If the bearish marubozu appears in a downtrend, it denotes a strong trend continuation. But appearing in an uptrend, it works as a trend reversal pattern, i.e. – that the market’s sentiment has changed and the stock is now bearish.
The real expectation is that with this sharp change in sentiment there will have a surge of bearishness and the bearishness will continue over the next few trading sessions. Hence a trader should look for selling opportunities after the occurrence of a bearish Marubozu. The suggested selling price is slightly below the closing price of the Marubozu (Bearish Breakout).
Bearish Marubozu Candle Trade Setup
It does not matter if a stock is in a downtrend or uptrend, when a Bearish Marubozu (large red candle) appears on the chart, it’s considered to be a very bearish sign. And that’s why we should sell the stock. And your position should be of SHORT.
- SELL PRICE – BEARISH Marubozu CANDLE AROUND CLOSING PRICE
- STOP LOSS – BEARISH Marubozu CANDLE AROUND HIGH PRICE
Example of Bearish Marubozu Candle
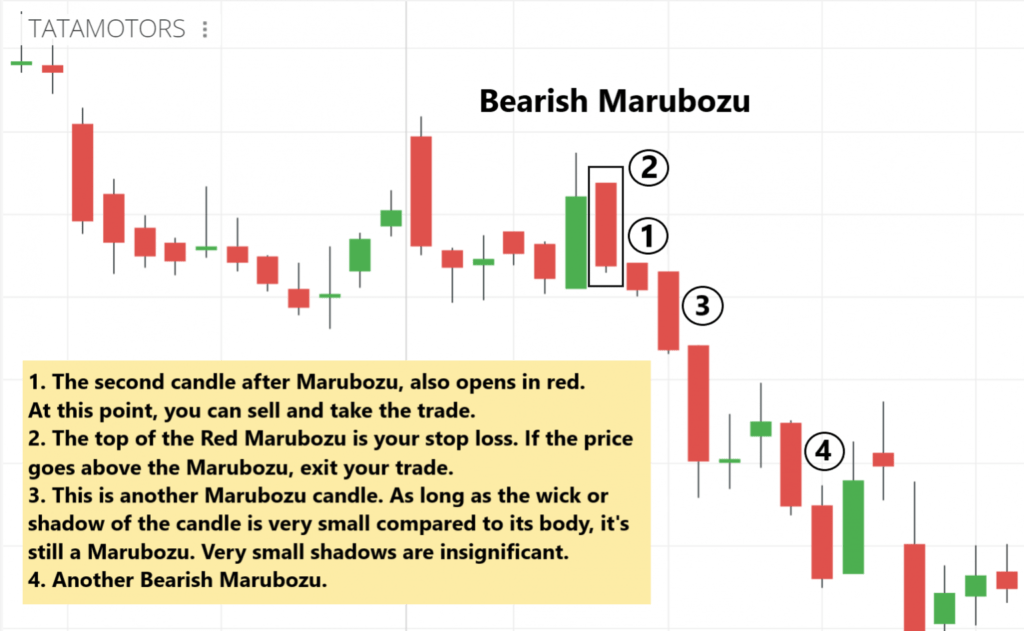
- The chart above is of the Automobile company ‘Tata Motors’.
- There are several ‘Bearish Marubozu’ candles in the chart. One such candle has been highlighted within the black box.
- You can short sell the stock when the candle after the first bearish Marubozu is also red. The stop loss will be the top of the red Marubozu.
- If the price goes above, you need to exit the trade immediately as the Marubozu has failed.
- Also note, small wicks or shadows (the small line below the candle) can appear. It doesn’t make much difference because small shadows mean the price only managed to recover a little. It’s insignificant.
Avoiding False Marubozu Signals and Setting Stop Loss
- In most cases, the stop-loss for any trade taken on the basis of Marubozu should be high or low of the candle.
- Though Marubozu is a very strong candlestick pattern, you should avoid trading on an extremely small (below 0.5% range) or long candle (above 5% range).
- An extremely small candle means reduced trading activity and hence it may be a false signal.
- Then again, a long candle indicates extreme activity and in that case, the stop-loss for that trade would be very deep.
- For this reason, you should avoid trading on candles that are either too short or too long.
- Also, you should also take further confirmation from another pattern or technical indicators before entering into the trade.
Conclusion
- Marubozu Candlestick Patterns for day trading or swing trading are usually the best trading patterns to take the trade.
- This setup is very easy and simple to use just you need to keep patience and let your setup form and then you can enter your trades.
- Stoploss should be low or high of the previous swing for uptrend and downtrend and the target would be as per your risk-reward ratio.
- One should follow the Risk Management, Money Management, and Fear and Greed concept of the market to avoid big losses.
- Make sure you see all our articles on candlestick patterns, so you can use them all in conjunction because you will be seeing or witnessing a lot of candlestick patterns, happening in the daily or the weekly charts or the hourly charts.
- If you have good knowledge of these patterns, you can take a very informed trade and you can maximize your returns.
- If you like this article kindly leave a comment in the comment section so that we can know what your thought about this Marubozu Candlestick Patterns.
- I hope you understand the Marubozu Candlestick Patterns of technical analysis very well.
- For more trading ideas do follow us on